
Your task is to help him work out how his cash flow will change over the year for different numbers of jobs that he hopes to get.
You are provided with a spreadsheet that has been partially completed. Download that at this link and save it.
1. You will need headings for the other months. Add February to December. (Remember, there is an easy way!)
2. Add a formula in cells G5 to G7 which will show the profit on each type of job. (Ignore other expenses at this stage, just take the cost away from the price)
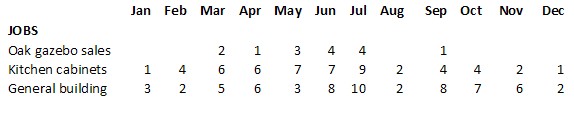
3. Add the number of jobs he expects to get each month from this table.
4. Enter a formula to show the total number of jobs each month
5. Enter a formula to enter the income for January from each type of job. This will be the job price x number of jobs
6. Show the total income figures in row 20, the sum of the three figures above
7. In the Expenditure section, the cost of the Oak timber will be the number of Oak gazebo jobs x the Oak gazebo cost. Similarly, you can enter formulae to show Kitchen cabinet materials and General building costs.
8. Wages are for someone to help with the building jobs. He pays £100 per building job
9. The other expenses, drawings to sundry expenses, can all be assumed to be the same each month. Use either a formula or other method to copy these across.
10. Show the total expenditure figures in row 38.
11. The monthly profit will be his total income – total expenditure
12. The bank balance for January is entered already. From February it will be January’s balance + February’s profit. That formula can be copied for the other months.
13. Create a chart that shows Peter’s total jobs each month
14. Create a chart that shows his profit or loss for each month. Change the colours displayed so that the months with a loss stand out (eg profit in green, loss in red)
15. Create a chart that shows how his bank balance will change over the year.
16. Create three charts which indicate the cost and profit components of each type of job, expressing each as a percentage.
17. Copy the spreadsheet and display the formulae used.
Peter now wonders what would happen if he had to take July off too and would not be able to do any jobs that month. He realises that he will have to reduce his monthly drawings (what he pays himself each month) as it is important that he does not go overdrawn in December. By changing his monthly drawings determine the most he can pay himself each month and still be in the black at the end of the year.
Keep a separate copy of the chart showing this.
Output
- Sheet with complete data entered
- A chart of total jobs each month
- A profit and loss chart
- A bank balance chart
- Job cost / profit charts
- Formulae sheet
- Effect of July holiday and lower drawings chart
No comments:
Post a Comment